Get our FREE resources: How To Become A Fluent English Speaker.
100% Free. No Spam.


Now you can learn English quickly by yourself at home for free step by step! It’s easy. Just choose the skill you would like to study and follow the instructions using the resources below. We also have various courses and lessons for those who want a more systematic approach.
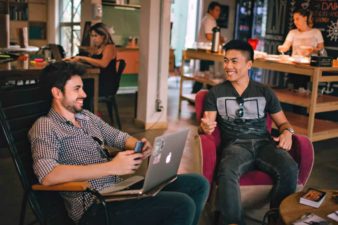
Practice Speaking.
Speaking English can be difficult at first. However, the more you practice and expose yourself to English speaking situations, the more fluent a speaker you will become.
The materials you’ll find in our Practice Speaking section will help you expand your knowledge of common words and phrases, conversation topics, and speaking situations you need to become a better English speaker. Simply click the button below to get started.
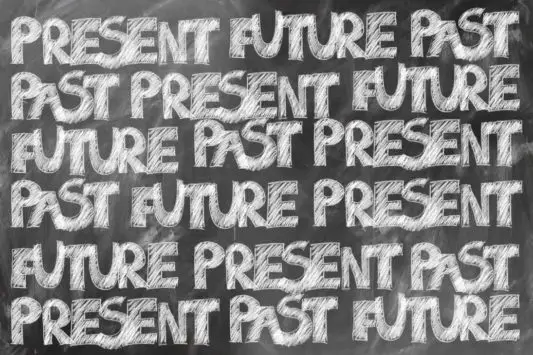
Improve Your Grammar.
English grammar is not difficult if you follow a logical plan for learning. Some of its rules make grammar challenging though.
This section will help you take your English grammar skills to the next level. Through lessons, videos, and other materials, you’ll learn how to sound better while speaking and writing. Click the button below to get started.
Build Your Vocabulary.
Improving your vocabulary is key to becoming a great English speaker. The more words you know, and the more comfortable you are using them, the more you’ll be able to connect with the people around you.
We’ve put together an incredible list of words and phrases, short articles, flashcards, quizzes and more to help you improve your English vocabulary. See our resources now by clicking below.

Practice Listening.
The best way to learn English as a second language is to immerse yourself in it as much as possible. This will help your brain make the connections it needs to make you a fluent speaker.
Our Practice Listening section will give you the tools you need to become good at listening and comprehending English. Get started right now by clicking the button below.

Practice Reading.
Reading has always been a great way of learning and building upon the knowledge of the great thinkers in that language. As you learn to read English, you will have access to a whole new world of information, people, and culture.
Our reading resources will help you improve your English reading skills. Check out our articles, flashcards, and videos to help you become a better English reader by clicking the button below.

Practice Writing.
Writing isn’t just a way of communicating information, it is also a way of expressing yourself to others. You can connect with others better by improving your English writing skills.
Communicate exactly what you’re trying to say and become a better English writer by checking out our writing resources. Click the button below to get started today.

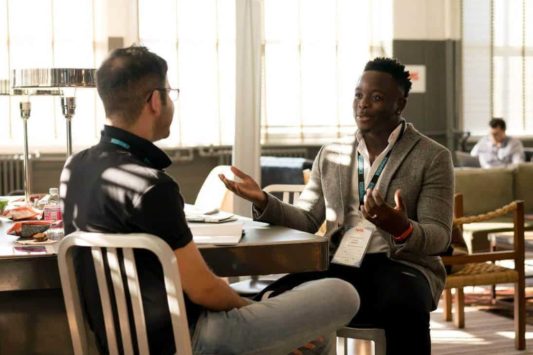
Business English.
Many employers in the United States, Canada, England, Australia, and other countries require that you be able to speak English as part of the job. Sometimes it’s hard to know what to say in a business setting, even if you speak English well around friends and family.
Our Business English resources will give you the useful phrases and information you need to take your English skills into the workplace. Click the button below and get started now.

Have you seen these tools yet?

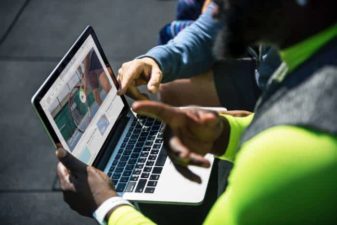


Teacher Resources
Are you a teacher, tutor, or study partner? If so, we’ve put together hundreds of resources to help you teach and practice English with another person.
Check out our Teacher Resources section for great handouts, lesson plans, and textbooks you can use in your teaching sessions. Simply click the button below to get started.
Ready to learn more?
Keep scrolling for more great English learning resources.
See our favorite ESL products.
Tutors help you on your personal path to perfecting English.

Books

Games

Software
Exam Preparation
You’ve done a great job learning English. Now it’s time to prove to the world you are ready to be an English speaking student, teacher, or business professional.
In this section, you’ll learn about major exams related to ESL that certify to others that you’re ready to participate fully in the English speaking world. Get started today by clicking the button below.
Sign up for an ESL class near you.
Structured in-person classes are a great way to develop your English skills.
TRY OUR FREE 5-DAY COURSE.
Learn how to become a fluent English speaker.
100% Free. No Spam.
Note: As an Amazon Associate, I earn from qualifying purchases.

